Introduce the second auxiliary plant of Shanghai Electric
power station, using intelligent power meters, collecting various electrical parameters and switching signals at the power distribution site. The system adopts the on-site local networking mode. After networking, it communicates through the fieldbus and travels to the background. Through the Acrel-2000 power monitoring system, the real-time monitoring and management of the power distribution circuit power distribution is realized.
Yang Junjun 1
1 Ankerui Electric Co., Ltd., Jiading, Shanghai 201801, China;
0 Overview
Shanghai Electric Power Station Auxiliary Machine No. 2 Factory is located on the bank of Huangpu River, Yangshupu Road, the birthplace of modern Chinese industry. Shanghai Electric Power Station Equipment Co., Ltd. Power Station Auxiliary Machinery Factory has become a subsidiary of Sino-German Joint Venture Shanghai Electric Power Station Equipment Co., Ltd. In 2011, it was selected as one of the first batch of “National Technology Innovation Model Enterprises”.
This project mainly involves network multi-function instruments in the power distribution room of the second auxiliary plant of Shanghai Electric Power Station. 21 circuits need to be monitored, and the monitoring host is located in the duty room on the first floor.
1 Demand analysis
In order to ensure the statistics and analysis of the electricity load for production management and real-time monitoring of dangerous sources. Real-time online monitoring of parameters such as voltage, current, and power in the incoming and outgoing circuits in the power distribution room at the project site is required. Once the monitoring point is abnormally monitored, the alarm can be detected in time, and the relevant personnel take necessary measures to avoid the occurrence of a safety accident. The automatic meter reading function saves manpower and material resources. The power trend curve function can intuitively display the working status and time of each loop, which is convenient for the user to find out the abnormal power circuit and timely rectify and establish the energy multi-level metering system to provide energy analysis basis. .
This technical condition applies to the distribution room of Shanghai Electric Power Station. Supplier products should be highly safe and reliable, easy to expand, and easy to maintain and maintain. The products provided by the supplier shall meet at least the technical conditions, but not limited to this, and its technical performance shall meet the requirements for data monitoring of the power distribution room.
data collection
Automatically collect analog data of all power meters in the field, and automatically collect switch data such as field switch status and fault status.
Support real-time acquisition, automatic cycle acquisition (timed acquisition) configurable cycle (1 minute to 24 hours).
Support data transmission correctness test, abnormal data automatic processing.
Support multi-thread processing mechanism, improve data collection efficiency, and can collect data for multiple devices at the same time.
The real-time data display adopts the visual display mode of the main wiring diagram, and the circuit breakers are disconnected and the fault status is visually visible.
Data analysis and processing
Comprehensive statistics and analysis of data need to achieve the following functions:
The statistics and calculations of the hours, days, months, and years of the electricity consumption data of each equipment.
The maximum, minimum, and average values of the electrical load (active, reactive) of each device are calculated.
Count the electricity consumption (active, reactive) of each substation and the whole.
Data query and display
It is required to facilitate the query of the client and the query of the management personnel at all levels. The query interface can meet the requirements of managers at all levels and can support flexible conditional combination query and comparative analysis. The data of various statistical analysis can flexibly adopt various charts such as reports. Intuitive display function.
The data display function can be divided into three levels: operation layer, management layer and decision layer according to the different permissions of different users.
The operation layer has functions such as energy analysis, cumulative usage, real-time monitoring, operation record and ratio, comparison, and benchmark analysis.
The management has functions such as energy statistics and analysis, classification and classification, and benchmarking.
The decision-making layer has functions such as energy data analysis, data deletion, and database import/export.
authority management
It is required to assign different roles to different users, and can authorize function submenus, specific file records, data records, and the like.
The system requires a reasonable and complete user security control mechanism to effectively protect the information resources in the application environment and prevent information loss, theft and destruction.
Energy-saving renovation and effect evaluation
It is required to provide data support for energy-saving retrofits and to provide an evaluation of the effects before and after energy-saving retrofits.
parameter settings
The transformer transformer ratio can be set through the collection cabinet, and various current and voltage protection settings can be set.
Fault judgment and alarm have automatic fault diagnosis and use sound and light mode alarm function. The types of alarms include switch faults, voltage and current overruns, communication faults in the field acquisition module, and communication faults with the monitoring system. The alarm time is automatically recorded in the system database, which is convenient for users to inquire. The staff can grasp the real-time running status of the variable power station at any time, find the fault of the power distribution and operate accordingly, improve the management efficiency of the power distribution and improve the safety of the power system. reliability.
2 system plan
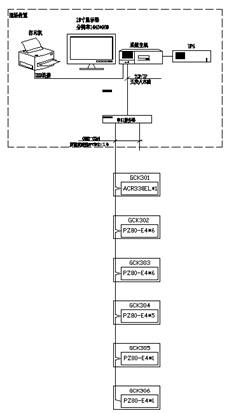
According to the actual situation of the second electric plant of Shanghai Electric Power Station, the Acre-2000 system adopts shielded twisted pair cable directly to the data collector and then directly connects to the monitoring host of the power distribution room through the network cable to ensure power management. Monitor system stability and real-time performance.
There are 21 Ankerui instruments in the field distribution room, which is divided into 1 RS485 bus to connect to the serial port server. The serial port server is connected to the monitoring room through the network cable to connect to the monitoring host to realize the data connection between the instrument on the bus and the monitoring host.
1) Station management
The management of the station control management system for the power monitoring system is a direct window for human-computer interaction. In the second electric power plant of Shanghai Electric Power Station, it mainly refers to the monitoring host placed in the first floor of the power distribution room.
2) Network communication layer
The communication layer is mainly composed of a Nport5232I, an Ethernet device and a bus network. The main function of the Nport5232I serial server is to monitor the on-site intelligent instrument; the main function of the Ethernet device and the bus network is to realize the data interaction between the substation and the main station, so that the distribution system management is centralized, informationized and intelligent, greatly improving The safety, reliability and stability of the power distribution system have truly achieved the goal of unattended operation.
3) Field device layer
The field device layer is a data acquisition terminal, which is mainly composed of smart meters. The smart meter is connected to the communication server through the shielded twisted pair RS485 interface, and uses the MODBUS communication protocol bus type connection to reach the communication host through the communication server. Implement remote control.
System structure diagram
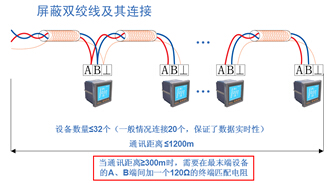
Smart meter field connection
The field instruments are connected by hand-shielded through shielded twisted pair (RVSP2*1.0). The number of smart meters connected to each bus is about 20, different types of smart devices are connected to different buses, and then the data is uploaded to the serial port. The server Nport5232I, and then upload the data to the local monitoring terminal. The specific connection diagram is as follows:
The incoming circuit adopts ACR330ELH multi-function liquid crystal display instrument, and the outlet circuit adopts PZ80-E4/C, which can measure all conventional power parameters, such as: three-phase voltage, current, active power, reactive power, power factor, frequency, active energy. , reactive power.
3 system function
The real-time monitoring system diagram of the substation is the main monitoring screen. The main operation status of all circuits in the substation is monitored in real time. Red represents the closing and green represents the opening. In the system diagram, you can visually see the operating parameters and status of each incoming and outgoing line. You can see all the conventional power parameters on the outgoing side of the transformer, such as: three-phase voltage, current, active power, reactive power, and power factor. , frequency, active power, etc. As shown below:
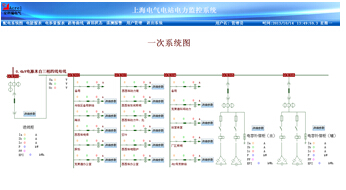
One system diagram
The remote signal and telemetry alarm function mainly completes the switch operation status and load line monitoring of the low-voltage outlet circuits. The switch position and load limit alarm pop-up alarm interface indicates the specific alarm position and audible alarm, reminding the on-duty personnel to deal with it in time. The load limit is freely set under the corresponding authority.
The event alarm recording function mainly completes the alarm information event record and the occurrence time of the alarm time period, provides the basis for the on-duty personnel and analyzes the cause of the accident, as shown in the following figure:
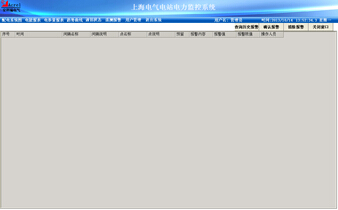
Alarm function real-time query
The parameter meter reading function mainly queries the electric parameters of the low-voltage outlet circuits. Supports electrical parameter query at any time, with functions such as data export and report printing. The report queries the electrical parameters of the low-voltage circuits in the distribution line of the distribution room of Xi'an Maternal and Child Health Hospital, including: three-phase current, active power and active power. The loop name of the report is associated with the database, which is convenient for the user to modify the loop name. As shown below:
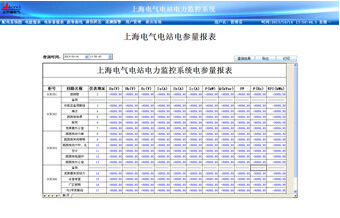
Electrical parameter reading
The power consumption report function can select the time period for query, support the electricity cumulative query for any time period, and have the functions of data export and report printing. Provide accurate and reliable energy reports for duty personnel. The loop name of the report is associated with the database, which is convenient for the user to modify the loop name. As shown in the figure below, the user can directly print the report and save it to another location in EXCEL format. As shown below:
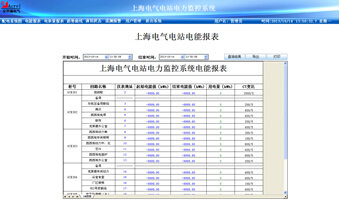
Energy report
The schematic diagram of the system communication structure mainly shows the networking structure of the system. The system adopts a layered distributed structure and monitors the communication status of the interval layer devices. Red indicates normal communication and green indicates communication failure. The following figure shows the state of the substation communication.
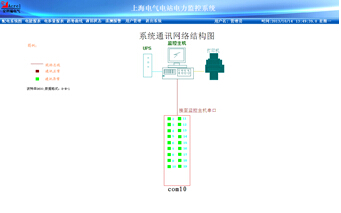
Communication structure diagram
The load trend curve interface can be used to visually check the load operation of the loop. View real-time and historical trend curves, click the corresponding button or menu item on the screen to complete the corresponding function switching; help users to enter the trend analysis and fault recall, with curve printing function. Provides intuitive and convenient software support for analyzing the health of the entire system. As shown below:
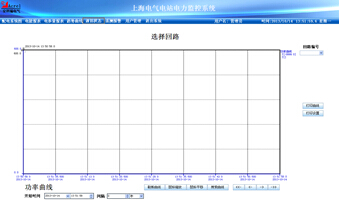
Trend graph
4 Conclusion
In today's power distribution facilities, the electrical distribution safety of electrical power station projects is of paramount importance. The application of the Acrel-2000 power monitoring system described in this paper in the second auxiliary plant of Shanghai Electric Power Station can realize the power supply and distribution of the power distribution room. The real-time monitoring of the loop power can not only display the power consumption of the loop, but also have the network communication function, and can form a power management system with the serial port server and the computer. The system realizes the analysis and processing of the collected data, displays the running status of each distribution circuit in the distribution room in real time, and has a pop-up alarm dialog box, voice prompts for the load limit, and generates various energy reports, analysis curves, graphics, etc. The remote meter reading and analysis and research of electric energy, the system is safe, reliable and stable, which provides a real and reliable basis for solving the electricity problem of the commercial square project, and has achieved good enterprise benefits.
references:
[1] "Guidelines and Application Guidelines for Digital Measurement of Electric Power Measurement", Ren Zhicheng, Zhou Zhong, China Electric Power Press
[2] "Application of Power Monitoring System in Power Supply and Distribution Design", Gao Shihong, Science and Technology Wind [3] "Power Monitoring for 10kv Power Supply and Distribution Design", Yao Qiang, Technology World
About the author: Yang Junjun, female, undergraduate. Position: Now working for Ankerui Electric Co., Ltd., contact number, mobile phone, QQ
Http://news.chinawj.com.cn Editor: (Hardware Business Network Information Center) http://news.chinawj.com.cn


 February 08, 2023